Most Insurance Loss Analytics
Barely Scratch the Surface
RiskMap® reveals structural patterns in your organization’s own historical loss data that traditional benchmarking methods often miss.
Schedule a Discussion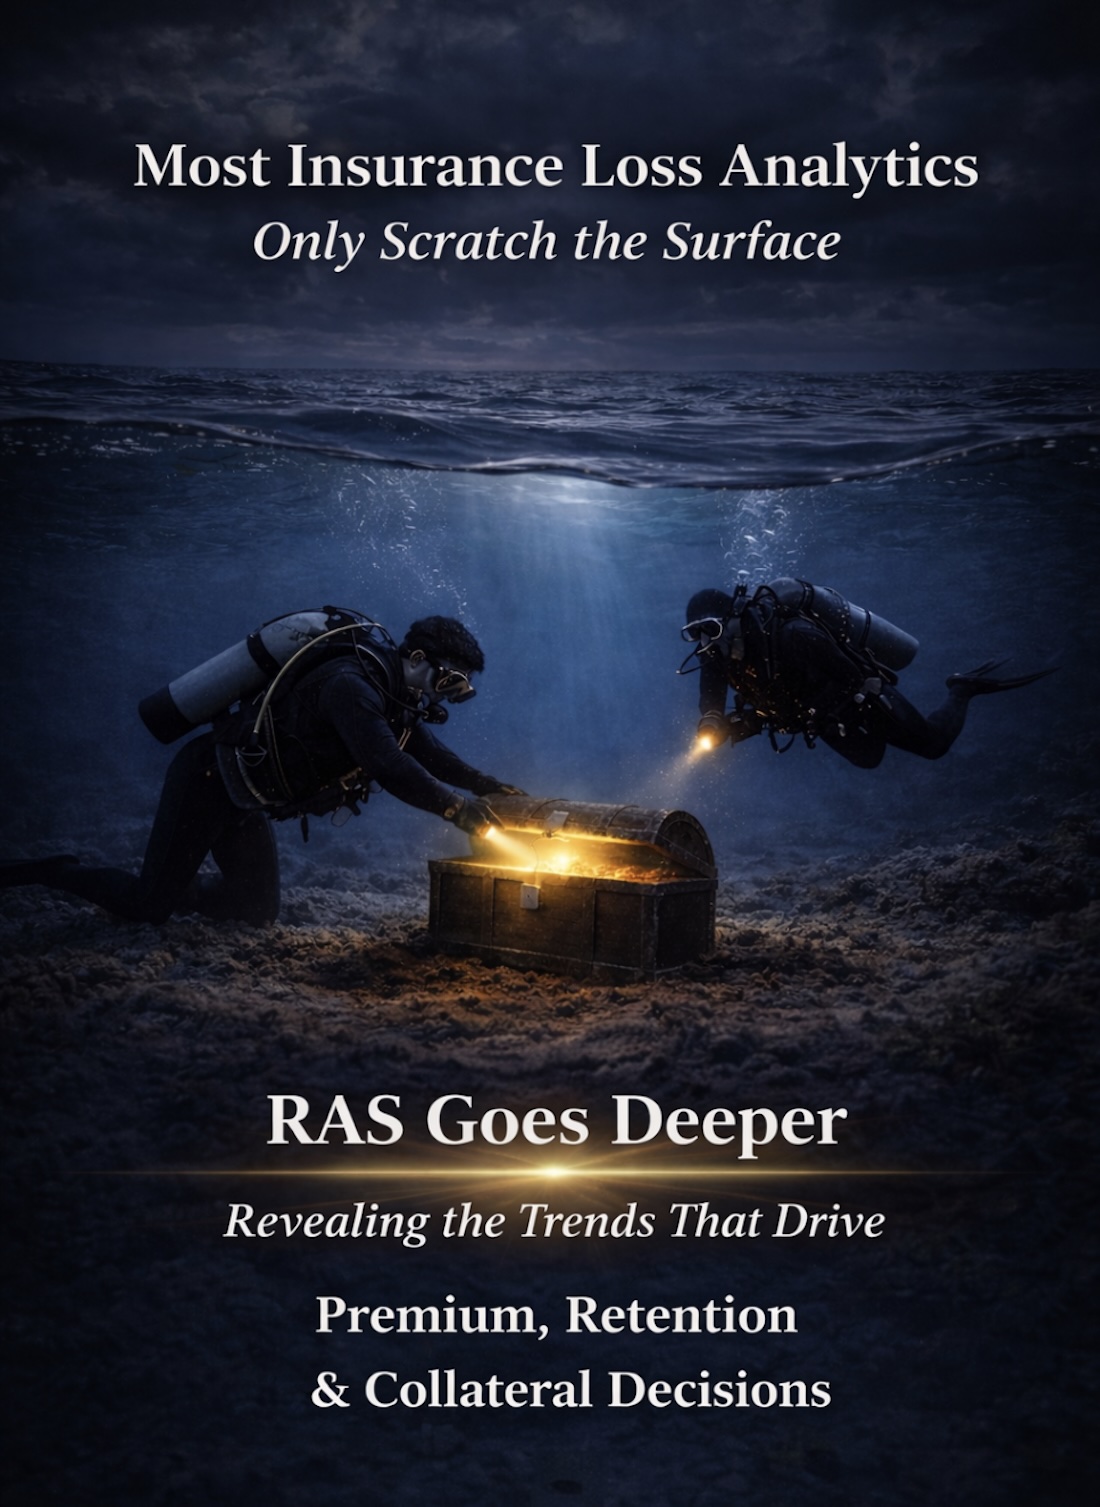
Real-World Result
“It helped our brokers negotiate a better rate and approach renewal discussions with greater confidence.”
Risk Manager, City of Aurora, Colorado
RiskMap analysis helped Aurora’s risk management team better understand the structure of its loss experience before renewal discussions.
Why RAS Looks Deeper
Most insurance analytics rely on industry benchmarks, modeling assumptions, or generalized loss patterns.
While benchmarking can sometimes provide useful context, it can also obscure important structural patterns within an organization’s own loss experience.
Risk Analysis Services takes a different approach.
RiskMap analyzes ONLY the client’s own historical loss data across multiple years — revealing structural patterns and trends that traditional benchmarking methods often distort.
When RiskMap Analysis Is Most Valuable
RiskMap analysis can be particularly valuable when organizations are facing complex renewal decisions or when traditional analytics do not fully explain the structure of their loss experience.
- Significant premium increases being proposed
- Retention adjustments under consideration
- Collateral requirements increasing
- Complex or volatile loss history
- Projected losses appearing significantly higher than insurance premiums
In these situations, analyzing the organization’s own historical loss data may reveal structural patterns that traditional benchmarking approaches overlook.
The RiskMap Advantage
Traditional insurance analytics often rely on benchmarks and assumptions that may distort how an organization’s own loss experience is understood.
RiskMap focuses entirely on the client’s own historical data.
This approach avoids many of the distortions that benchmarking can introduce and allows the structure of the client’s own loss experience to become clearer.
- No industry benchmarks
- No modeling assumptions
- No external adjustments
By examining the client’s own loss history across multiple years, RiskMap often reveals insights that can strengthen renewal negotiations and improve financial outcomes.
Who This Is For
Risk Managers
Understand the structural patterns in your organization’s loss experience that may influence premiums, retentions, and collateral requirements.
For Risk Managers →Insurance Brokers
Provide clients with deeper insights into their loss experience and strengthen your negotiating position with underwriters.
For Insurance Brokers →How RiskMap Creates Structural Insight
RiskMap organizes and analyzes historical loss data in ways that allow structural patterns to emerge clearly across multiple years of experience.
These patterns often provide insights that are not visible through traditional benchmarking approaches.
The RiskMap® methodology was developed by Alan Cantor, co-founder of Risk Analysis Services.
Start a Conversation
Organizations with significant casualty insurance programs often find that their historical loss data contains insights that traditional analytics overlook.
If you would like to explore whether a RiskMap analysis might provide useful insights, we would be happy to schedule a brief discussion.
In many cases the relevant loss data is held by brokers, TPAs, or insurers. During an initial discussion we can talk about how the data may be obtained and reviewed under appropriate confidentiality protections.